Blog • 18th October 2023
Steam Benchmarks & Estimates: The Other Side Of Market Analysis
🧐 Learn about wishlists, followers, and activations – and how to benchmark with Steam data!
Table Of Contents
- Estimating Sales From Steam Reviews
- Gauging Wishlists From Followers
- Predicting Sales From Wishlists
- Calculating Net Revenue From Sales
- Steam Benchmarking and Analysis FAQs
In our previous article, we looked at some free tools to get data for your marketing analyses.
These websites and data already paint a pretty detailed picture of the indie games scene, but can we also use them to see what the competition is up to?
The answer is yes — at least to a certain extent!
While there’s no 100% accurate way to get competitors’ info — well, aside from asking them directly — there are formulas that will return some pretty close estimates for a lot of useful information. Let’s dig a bit deeper…
Estimating Sales From Steam Reviews
On average, there are 20 - 50 sales for each review.
Back before platforms like SteamSpy were a thing, a group of journalists and developers first came up with a coefficient — a fancy word for a fixed value — one could multiply a game’s Steam reviews by to get a more or less clear idea of how many people had bought it.
While I’ll stay out of the mathematical intricacies behind what’s known as the Boxleiter Method (Jake Birkett wrote a very cool article about it here) the results ranged from 30 to 100, with a median value of just over 60 owners per review around 2014.
Birkett and a few others went back to the Boxleiter number over the years, attempting to update the value to reflect market changes. According to recent estimates, that range has now dropped considerably - getting closer to 20 to 50 owners per review.
That is to say, if a game released after 2020 has 100 reviews on Steam, it’s likely the developers managed to sell anywhere between 2,000 and 5,000 copies of it.
Unfortunately, just like any other estimate, it takes very little to skew the numbers here. Things like the game’s genre, the actual year it was released in, its quality, and even the number of reviews it received over time have all been shown to influence the results.
So, while the Boxleiter method can give us an idea of how much a game might have sold, there’s no guarantee the results will be accurate.
Gauging Wishlists From Followers
On average, there 9.6x wishlists for each follower.
As a fundamental indicator of a game’s potential success, and the basis of many visibility algorithms on the platform, wishlists are another one of Steam’s best-guarded secrets.
Historically, however, developers could still guess a competitor’s wishlists by looking at their followers and multiplying that value by five (if you’re wondering why five, Jake Birkett explains the maths behind it in a series of tweets here).
Like many other things, that changed when — in late 2019 — Steam first allowed developers to showcase their games before release.
Simon Carless dedicated one of his newsletters to this change in 2021, noticing how the new wishlists to followers ratio ranges between 5x and 14x — with a median value of 9.6x — depending on whether the game in question had joined any festival or promotional opportunity during their lifecycle.
Carless’s findings show us a couple of things: not only did the median value virtually double in the span of a year, but festivals and pre-release showcase opportunities also greatly changed how people interact with games on Steam.
As a result, while simply using the new 9.6x median value to estimate wishlists from followers might be an easy approach, you should also consider deconstructing your competitors’ marketing strategy if you’re after more accurate data.
Carless’s latest update in June 2023, reports unreleased and genre-specific multipliers between 7x and 20x, with a median of 12x. All of that depends on genre and much more, so tl;dr do your own research!
Predicting Sales From Wishlists
On median average, 20% of wishlists convert to purchase the game in week 1.
We said before that wishlists can be a solid indicator of how likely a game is to do well.
To understand exactly how well, we once again turn to Simon Carless’s research (sometimes I wonder how the games industry would do without people like him) published in another one of his newsletters in mid-2020.
Looking at a mix of early access and full releases, Simon found out that the median wishlist to week-1 sale ratio for the entire dataset sat at about 0.2.
In other words, only 20% of people that wishlisted the game ended up buying it during the first week. Results changed slightly when only looking at full releases or early access titles (a median value of 0.22 and 0.16 respectively) and the data also showed some pretty big variation, with a number of titles performing unexpectedly well while others did unpredictably bad.
As for year-1 sales? According to the handful of people that looked into it, the answer lies anywhere between the 2x and 5x week-1 sales marks.
So, if your game sold 10,000 copies during its first week, it’s likely it’ll sell between 20,000 and 50,000 copies in its first year on the market.
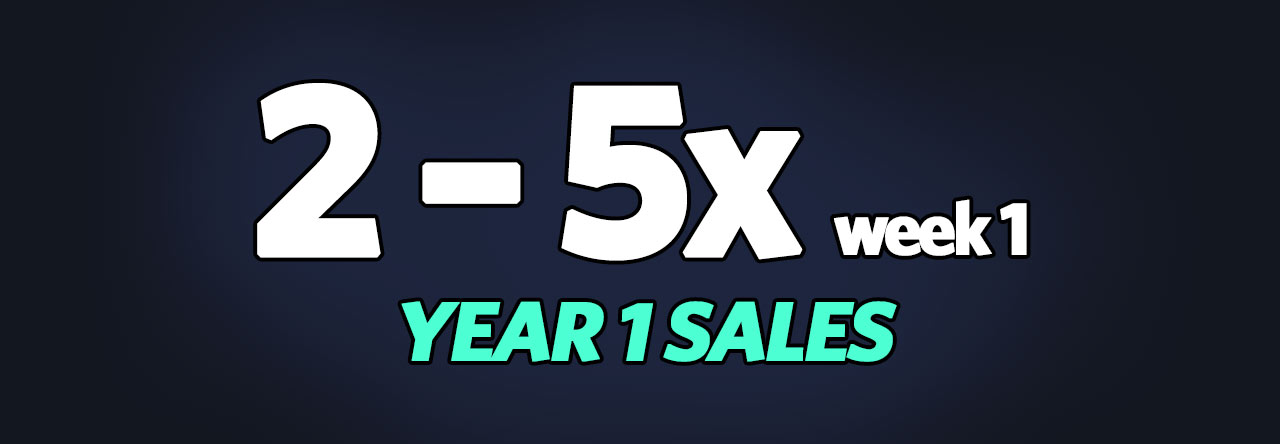
On average, a game sells 2x - 5x its week 1 sales in year 1.
Calculating Net Revenue From Sales
Once you have a general idea of how many copies your indie game might sell, it’s tempting to just multiply that for the game’s full price and call it a day.
Unfortunately, even if you just wanted to get a very rough estimate of your potential revenue, that approach would likely not be the best one.
Staying away from anything related to production, marketing, advertising and publishing, a more accurate revenue estimate should still account for several expenses.
Although looking at them all would require some time, the most important of these include:
- Steam’s cut — which sits at around 30% for a majority of the games on the platform.
- Refunded copies — AKA anybody that bought your game, then decided that “nah, this isn’t for me”. These are hard to predict but usually fall somewhere in the 5% to 10% of the total range.
- Regional pricing differences and discounts — because your game won’t cost the same throughout the world, and you’ll likely put it on sale at some point. Again a tough one to predict, but data shows that these usually account for a 30% to 50% revenue difference.
- V.A.T. and local taxes — which will largely depend on where you live and where your studio operates.
- Any other expenses and fees — including the 100$ Steam Direct Fee, bank transfers, and anything you’ll need to pay to actually get the money.
Some napkin maths later, developers usually only see between 30 and 45% of the money their games make. This is often overlooked in revenue calculations, and if not considered in projections, could spell disaster for a new indie studio.
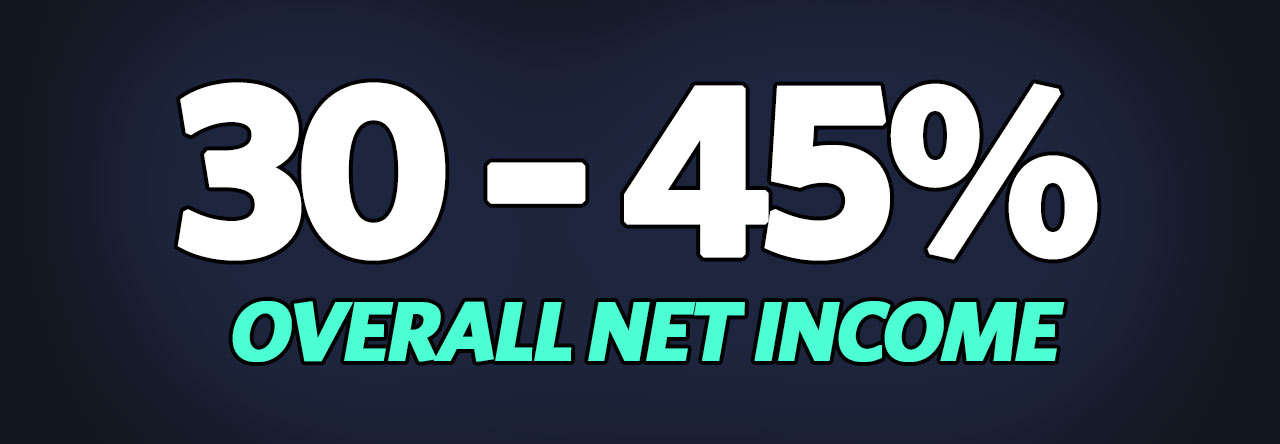
After taxes and other cuts, less than half makes its way to your bank account.
If you want an easier way to estimate any Steam game’s potential revenue, the IMPRESS toolkit includes a free Steam revenue calculator that you can check out here!
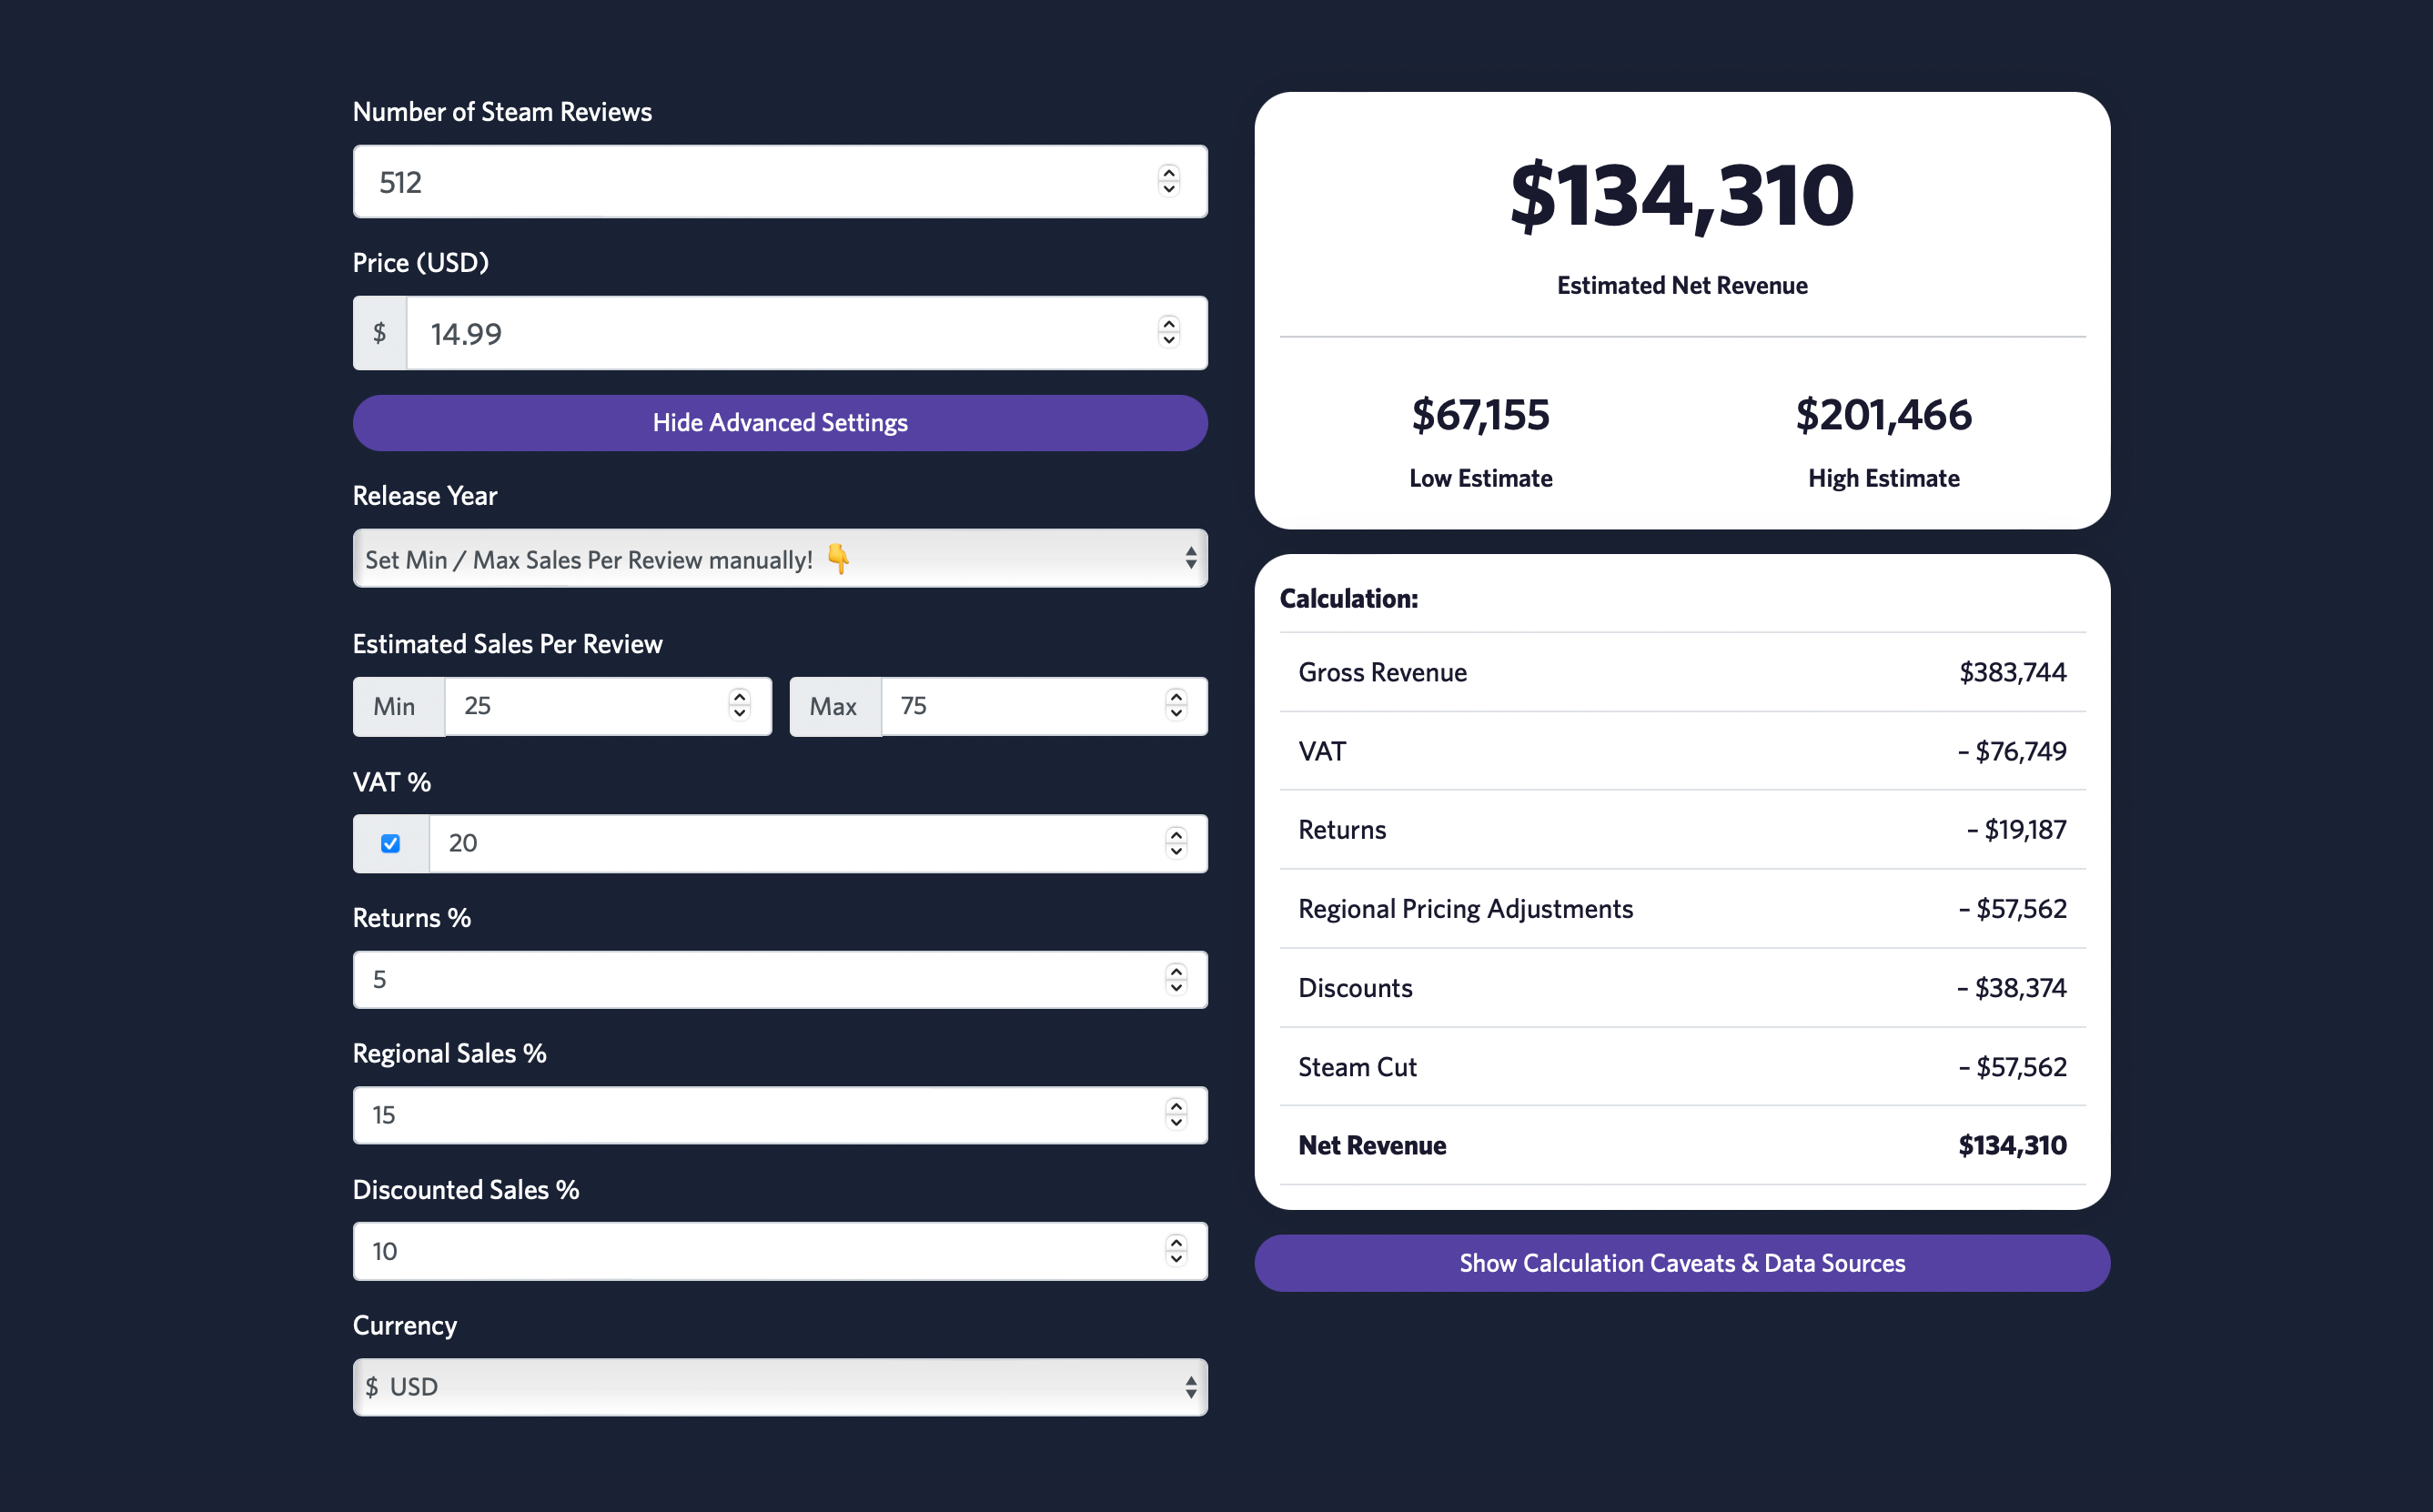
Steam Revenue Calculator – try it now!
Best of luck!
- Ashley
Steam Benchmarking and Analysis FAQs
Q: How can I estimate how many copies a game sold on Steam?
The number of reviews a game has on Steam can offer a pretty good picture of how many copies the title sold on the platform. According to the Boxleiter Method, games on Steam receive a review every 20 to 50 copies sold. That is to say, if an indie game has 100 reviews on Steam, it's likely it sold between 2,000 and 5,000 copies!
Q: How can I see a game's wishlists charts on Steam?
The Steamworks backend offers daily wishlist data updates for any game you publish to the platform. Unfortunately, no wishlist charts are available on Steam for games you didn't publish. That said, you can still look at how many followers a game has to estimate how many people added it to their wishlists. As of 2024, the median value is 9,6 wishlists per follower - with games in specific genres and niches going as high as 12. A game with 100 followers, as a result, will have between 960 and 1200 wishlists.
Q: How can I predict my game's sales data on Steam?
The number of people who added your indie game to their wishlists can give you a glimpse into how well the title will do at release. On average, in the first 7 days after release, roughly 20% of the people who wishlisted your game will go ahead and buy it. This will also set the trend for the first year, with most indie games selling 2 to 5 times the copies they sold in week-1 during their first 365 days on Steam.
Q: How do I estimate revenue from my game on Steam?
Calculating take-home revenue for your indie game can be tricky. As you do so, you'll need to account for Steam's cut, regional pricing differences, taxes, expenses, fees, and refunded copies. As a general rule, you can expect between 30 and 45% of your game's gross income to make it to your bank account. If you want an easier way to estimate any Steam game's potential revenue, don't forget to check out our free Steam Revenue Calculator tool!

More from the ✨ Academy ✨
How to Promote Your Indie Game On Reddit Without Losing Your Sanity
🧭 Learn the basics to navigate the world of Reddit and put your game in front of more eyes!
By Ashley
28th August 2024
Five Exemplary Indie Games Christmas Updates To Ring In The Holidays
🎅 Take a look at what other developers are doing – get inspired to make the most out of the last few weeks of the year!
By Alessandro
19th December 2024
Make Your Game A Success!
With access to:
Coverage Bot
Press Kitty (free)
Academy (free)
Launchpad (free early access)
Steam Revenue Calculator (free)
...and more tools coming soon!
Get started with our innovative video game marketing toolkit, today!
✨ We'll also email you every time we write a blog post! ✨
